Ramachandran Plot as a Tool for Peptide and Protein Structures’ Quality Determination
Krzysztof Brzozowski
University of Gdansk, Faculty of Chemistry
A few words of introduction
An assembly of a molecule and understanding of structure-activity relationship are one of the key tasks of structural biochemistry. Both peptides and proteins belong to the most frequent studied group of biopolymers. It is so because of their participation in many biochemical processes taking part in living organisms. Below the main functions of proteins are listed:
- structural – structural proteins are responsible for the cell and tissue shape. Collagen and histones are good examples of such proteins;
- transport – e.g. hemoglobin which is responsible for oxygen and carbon dioxide transport between lungs and tissues;
- protective – immune system protects the organism from pathogens and foreign substances. It’s key compound is immunoglobulin G;
- regulatory – in the biochemical chain proteins play both signal and receptor functions. E.g. complex of somatotropin and its receptor activates cytoplasmic domain and leads to transduction of the cell;
- catalytic – enzymes are the biggest group of proteins (approximately 2000 known biomolecules);
- mobile – e.g. interactions between actin and myosin are responsible for muscle contraction and cellular movements;
- storage – plants contain special proteins, which are important to human because of dietary reasons, e.g. kasein or ferritin.
Why it is worth to use the tool
The backbone’s conformation can be defined by determining the orientation of the two peptide groups linked directly to the same Cα atom – fig.1.
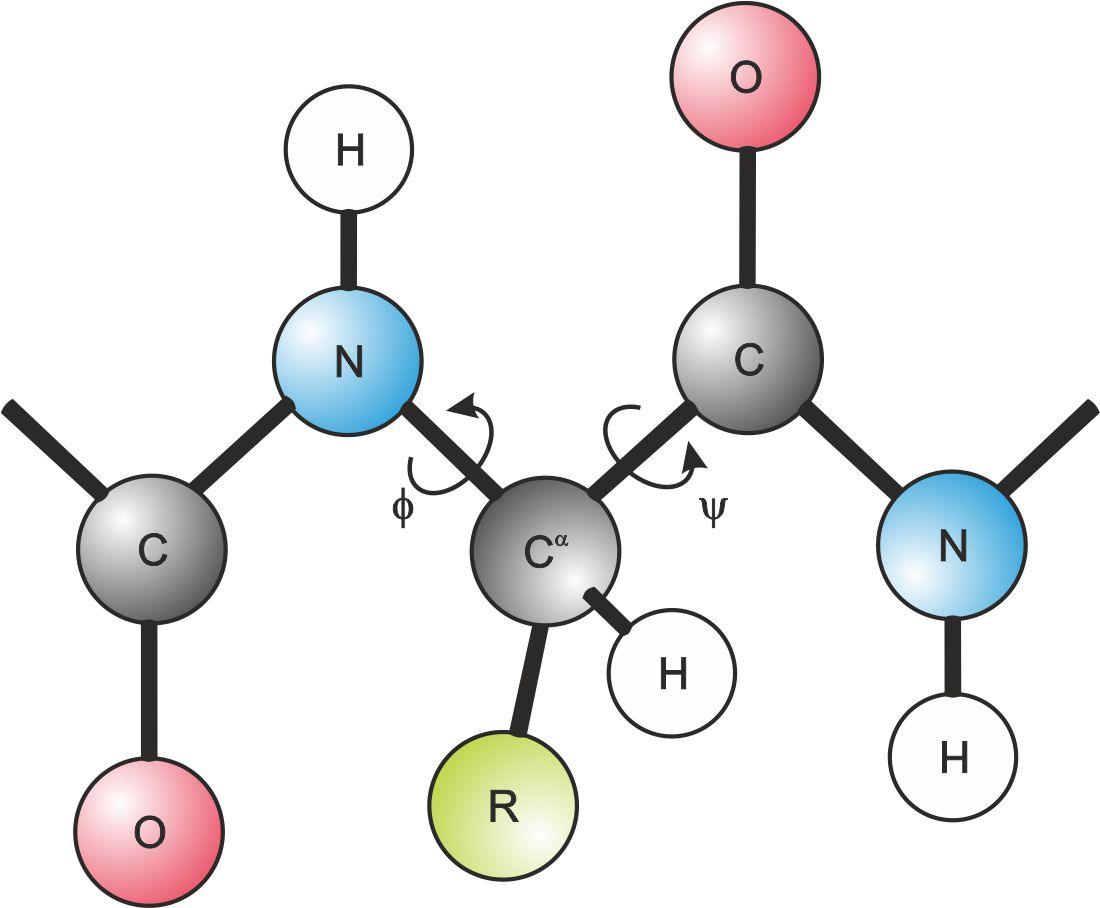
Figure 1. Dihedral angles describing the orientation of two peptide bonds linked at the same Cα atom
Figure 1. Dihedral angles describing the orientation of two peptide bonds linked at the same Cα atom
Studying many combinations of ϕ and ψ dihedral angles, Ramakrishan and Ramachandran prepared the plot of their dependencies [1]. Moreover they defined areas corresponding with secondary structure elements – fig.2.
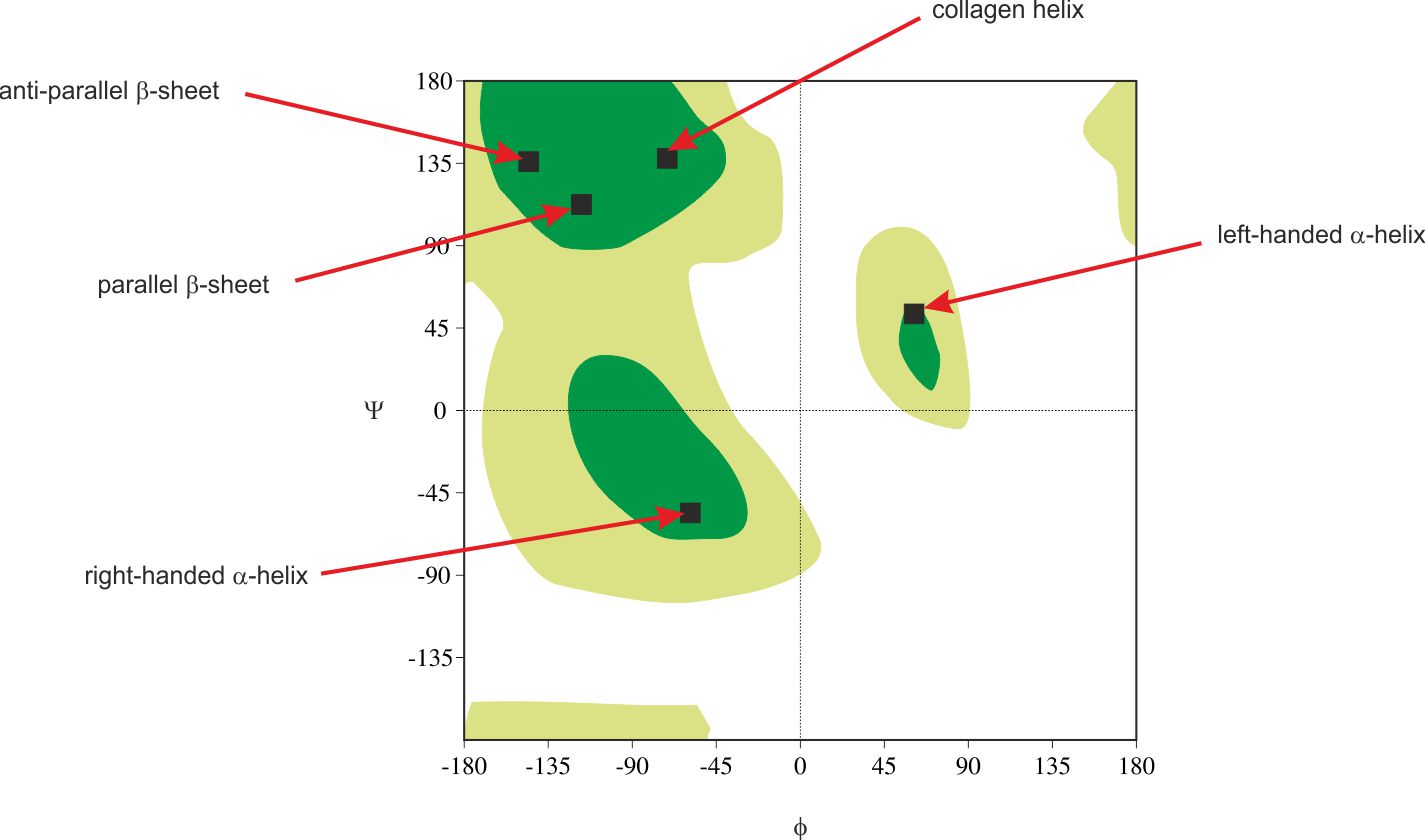
Figure 2. Ramachandran plot with the most favoured (dark green) and additional allowed (light green) regions
Figure 2. Ramachandran plot with the most favoured (dark green) and additional allowed (light green) regions
In conformational analysis Ramachandran plot can be used to determine if obtained conformation of the backbone is correctly generated. Sometimes the final structure produced with the usage of computer calculations might not be totally relaxed. It is impossible to check the whole structure using visualization software only. Many steric distortions are the result of wrong conformation of the backbone. Presented here tool is one of the simplest, fastest and most popular when checking the quality of peptide or protein models. In figure 3 there are examples of secondary structure elements and placement of exemplary steric distortion where two oxygen atoms are too close to each other.
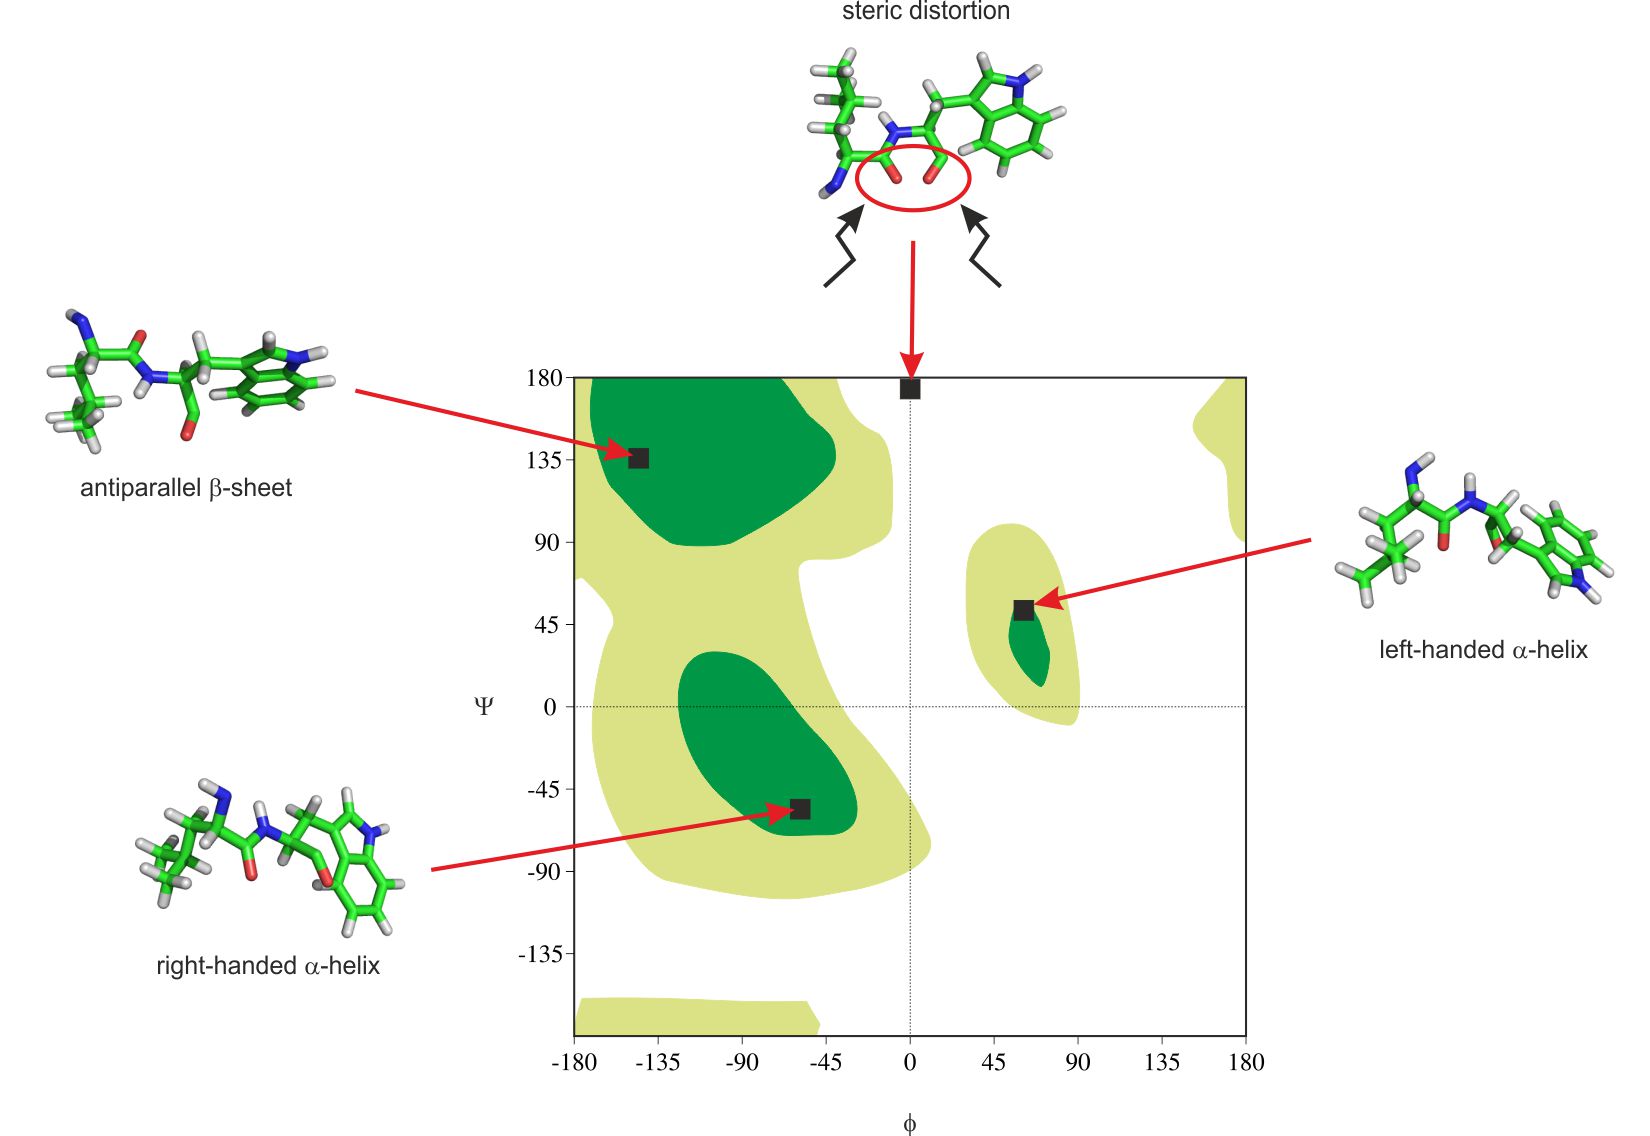
Figure 3. Ramachandran plot with marked secondary structure elements and example of steric distortion
Figure 3. Ramachandran plot with marked secondary structure elements and example of steric distortion
Among all the freeware tools for generating Ramachandran plot, ProCheck [2] is the most recommendable. Applied in this package approach divides the plot area into four types shown in figure 4.
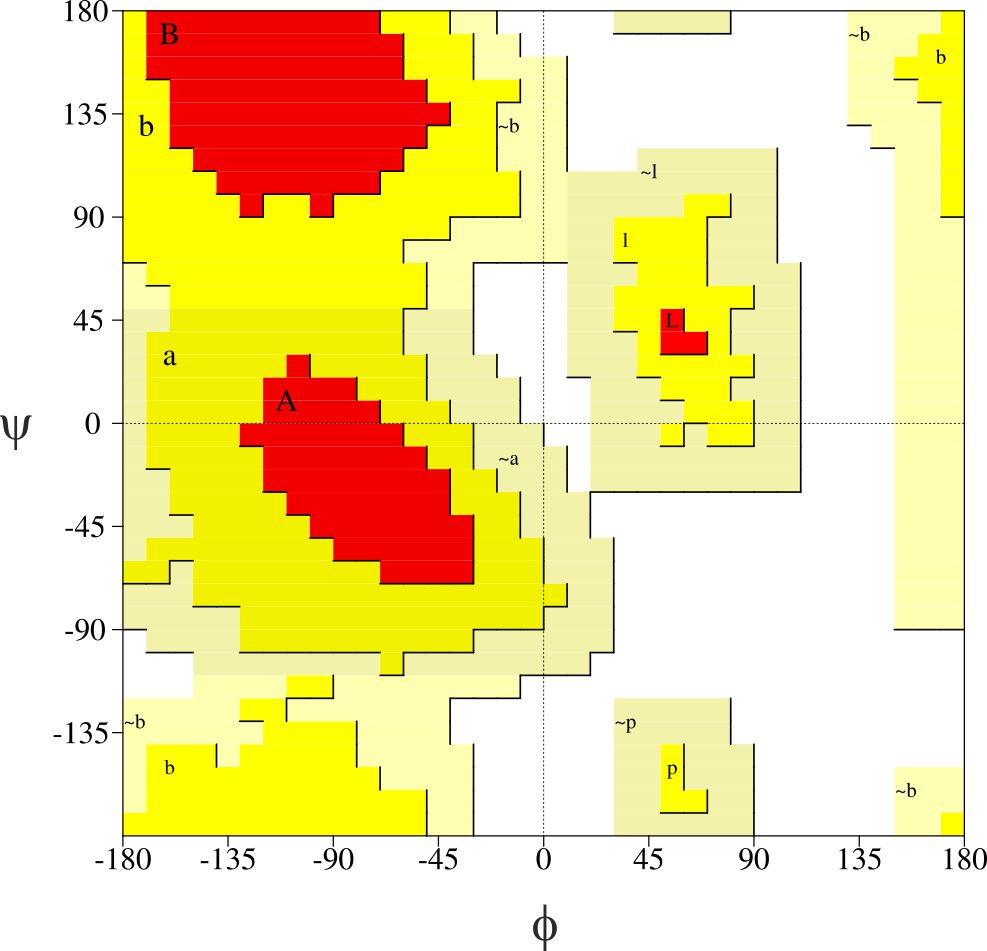
Figure 4. Ramachandran plot generated in ProCheck software. The plot area is divided into four following regions: most favoured (red), additional allowed (yellow), generously allowed (light yellow) and disallowed (white)
Figure 4. Ramachandran plot generated in ProCheck software. The plot area is divided into four following regions: most favoured (red), additional allowed (yellow), generously allowed (light yellow) and disallowed (white)
A good model should usually contain 90% of all ϕ and ψ values in the most favoured regions. The extension of the plot proposed by Laskowski et. al. can lead to some misunderstandings when the tool is used without deeper insight into obtained results. The dihedral angles of some amino acid residues which are in the additional or generously allowed regions can be subjected to further relaxation in the particular force field. Moreover such a step leads to lower total energy of the molecule and helps get rid of some structural violations. One of the key advantages of ProCheck is total statistics of the model including the percentage amount of secondary structure elements. A possible disadvantage is system platform, so far it works under Unix and Linux systems only.
Another free tool is Swiss-PdbViewer [3] which runs under both Windows and Linux systems. It is visualisation package which allows to generate the Ramachandran plot for displayed model. In the next figures there are shown plots prepared using mentioned software.
The structures derive from PDB database available under the following address: www.pdb.org. In figure 5 the structure of myoglobin [4] and its Ramachandran plot is shown. This globular protein characterize big amount of helices what is reflected in values of ϕ and ψ dihedral angles. Similar situation takes place in bovine rhodopsin [5] – fig. 6. On the other hand there are many proteins containing pleated sheet – also very common secondary structure element. The example of such molecule is present in figure 7 [6].
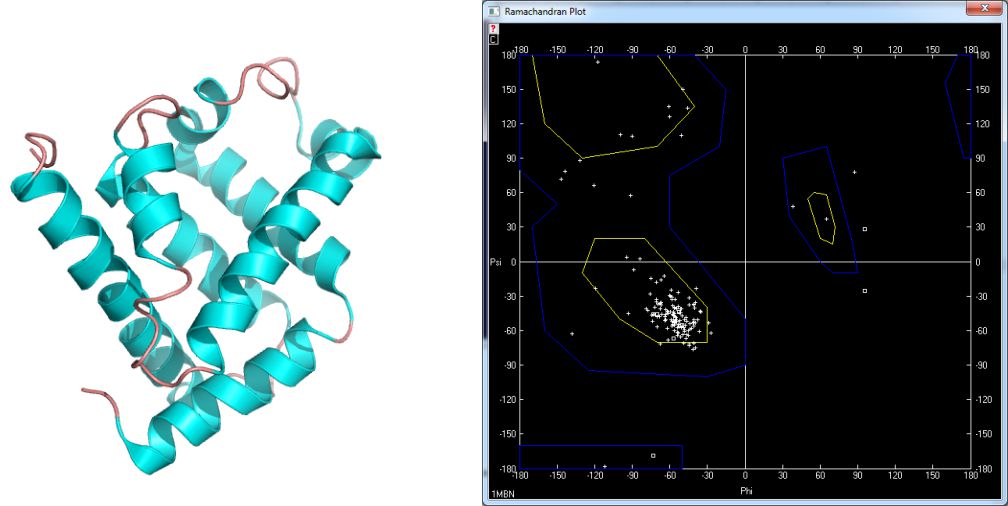
Figure 5. Myoglobin [1mbn] and its Ramachandran plot
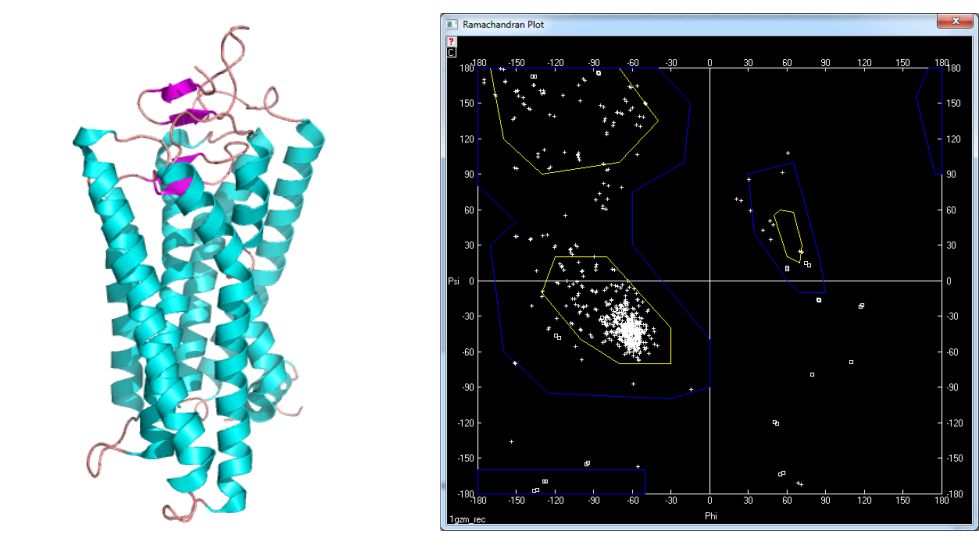
Figure 6. Structure of bovine rhodopsin [1gzm] and its Ramachandran plot
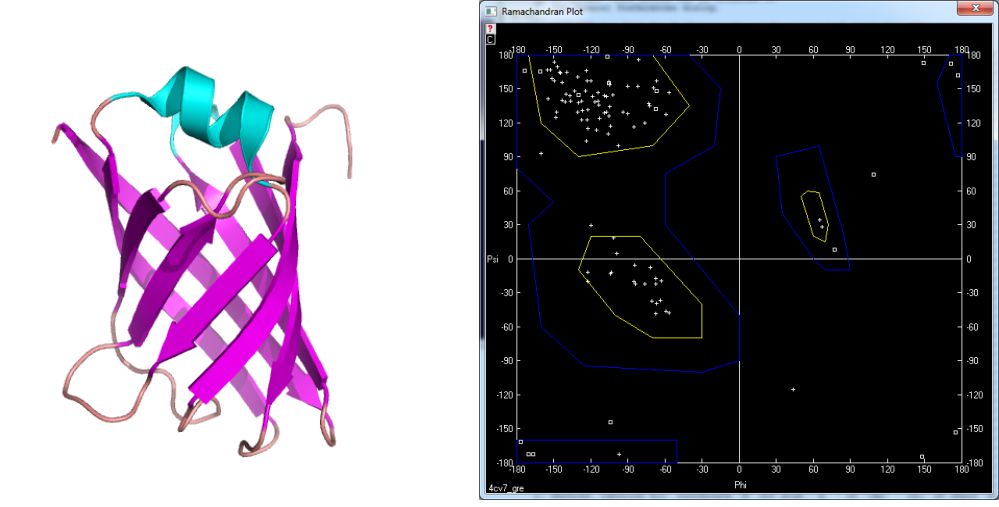
Figure 7. Model of VAPB protein [4cv7] and its Ramachandran plot
References
[1] G.N. Ramachandran, C. Ramakrishnan, V. Sasisekharan, Stereochemistry of polypeptide chain configurations, J. Mol. Biol., 7, 95 (1963).
[2] R.A. Laskowski, M.W. MacArthur, D.S. Moss, J.M. Thornton, PROCHECK - a program to check the stereochemical quality of protein structures, J. Appl. Cryst., 26,
283, (1993).
[3] N. Guex, M.C. Peitsch, SWISS-MODEL and the Swiss-PdbViewer: An environment for comparative protein modeling, Electrophoresis, 18, 2714 (1997).
[4] H.C. Watson, The Stereochemistry of the Protein Myoglobin, Prog. Stereochem., 4, 299 (1969).
[5] J. Li, P. Edwards, M. Burghammer, C. Villa, G.F.X. Schertler, Structure of Bovine Rhodopsin in a Trigonal Crystal Form, J. Mol. Biol., 343, 1409 (2004).
[6] C. Geerds, J. Wohlmann, A. Haas, H.H. Niemann, Structure of Rhodococcus Equi Virulence-Associated Protein B (VAPB) Reveals an Eight-Stranded Antiparallel [Beta]-Barrel Consisting of Two Greek-Key Motifs, Acta Crystallogr., Sect. F, 70, 866 (2014).
Figure 5. Myoglobin [1mbn] and its Ramachandran plot
Figure 6. Structure of bovine rhodopsin [1gzm] and its Ramachandran plot
Figure 7. Model of VAPB protein [4cv7] and its Ramachandran plot
References
[1] G.N. Ramachandran, C. Ramakrishnan, V. Sasisekharan, Stereochemistry of polypeptide chain configurations, J. Mol. Biol., 7, 95 (1963).
[2] R.A. Laskowski, M.W. MacArthur, D.S. Moss, J.M. Thornton, PROCHECK - a program to check the stereochemical quality of protein structures, J. Appl. Cryst., 26,
283, (1993).
[3] N. Guex, M.C. Peitsch, SWISS-MODEL and the Swiss-PdbViewer: An environment for comparative protein modeling, Electrophoresis, 18, 2714 (1997).
[4] H.C. Watson, The Stereochemistry of the Protein Myoglobin, Prog. Stereochem., 4, 299 (1969).
[5] J. Li, P. Edwards, M. Burghammer, C. Villa, G.F.X. Schertler, Structure of Bovine Rhodopsin in a Trigonal Crystal Form, J. Mol. Biol., 343, 1409 (2004).
[6] C. Geerds, J. Wohlmann, A. Haas, H.H. Niemann, Structure of Rhodococcus Equi Virulence-Associated Protein B (VAPB) Reveals an Eight-Stranded Antiparallel [Beta]-Barrel Consisting of Two Greek-Key Motifs, Acta Crystallogr., Sect. F, 70, 866 (2014).